performance_schema
简介
pfs, MySQL 自带的内核检测工具,用于监控 MySQL 服务器的运行状态,包括 CPU、内存、磁盘、网络、线程等资源的使用情况,以及 MySQL 服务器的内部运行状态,包括连接、查询、锁、事务等。
研究各项指标的检测实现,也不失为一种看源码的好方法
检测维度
- 代码高度耦合,即使使用宏对核心代码进行包装,但是还有有部分对外的代码嵌在内核的各个角落,不知都对性能有没有影响
- 需要对一个系统接口深度定制,例如 thread,mutex 等,如果使用 c++ 重写估计会简介很多
- 资源消耗严重,状态信息都是保存在内存中,但是理论上这些信息可以在获取是再汇总,或者简单再处理下即可
- pfs 已经默认开启许久,许多工具已经有一定的依赖性,对内,某些功能依赖这个组件,例如显示 thread 的名字,pfs不开,名字统一为 mysqld,对外,可能有些工具依赖
- 此外不确定关闭宏之后,代码是否还正常
- 为什么不直接使用时获取资源,而是需要保存再获取呢
- 多线程,有什么不知道的难点吗
-
PSI_THREAD "thread instrumentation"
- 所有指标的核心,只有打开这个指标,其他的才可以使用,使用 HAVE_PSI_THREAD_INTERFACE 宏进行判断。
- 通过 包装 thread 相关的系统调用,获取线程的创建、销毁、切换等信息,包括线程的状态、资源消耗、等待时间等。
- 内部包装 inline_mysql_thread_xxx 系列函数,大部分在功能没有打开的时候,几乎不起作用
- 当前线程的所用信息保存在 THR_PFS 中,理论上可以从这个对象找到所有当前线程你想要的信息
- 由 全局对象 global_thread_container 保存所有 THR_PFS 对象,查询 threads 表的时候,从这里获取信息
-
PSI_MUTEX "mutex instrumentation"
- 使用 HAVE_PSI_MUTEX_INTERFACE 控制相关功能
- innodb 和外部 SQL 引擎部分不是同一种 mutex,实现机制不一样
-
PSI_RWLOCK "rwlock instrumentation"
-
PSI_COND "condition instrumentation"
-
PSI_FILE "file instrumentation"
-
PSI_TABLE "table instrumentation"
-
PSI_SOCKET "socket instrumentation"
-
PSI_STAGE "stage instrumentation"
-
PSI_STATEMENT "statement instrumentation"
-
PSI_SP "stored procedure instrumentation"
-
PSI_PS "prepared statements instances instrumentation"
-
PSI_IDLE "idle instrumentation"
-
PSI_STATEMENT_DIGEST "statement digest instrumentation"
-
PSI_METADATA "metadata instrumentation"
-
PSI_MEMORY "memory instrumentation"
-
PSI_TRANSACTION "transaction instrumentation"
-
PSI_ERROR "server error instrumentation"
-
PSI_DATA_LOCK "data lock instrumentation"
- 相比 pg 的 pg_lock,MySQL 可以更直观的看出谁在等谁,但是 pg 实现的更轻量级
-
PSI_TLS_CHANNEL "tls channel instrumentation"
- 记录 tsl 状态
-
PSI_SERVER_TELEMETRY_TRACES "server telemetry traces instrumentation"
- 实现 telemetry 功能,但是是侵入式实现,且没有见过的东西,可以直接删掉
-
PSI_SERVER_TELEMETRY_LOGS "server telemetry logs instrumentation"
-
PSI_METRICS "server telemetry metrics instrumentation"
使用案例
架构
作为 MySQL 的一个存储引擎,内部存储各项系统指标,
http://mysql.taobao.org/monthly/2021/09/03/
必要性?
- 内部一些瞬时指标,是否可以直接获取,而不需要存储
- 那些指标是需要体现变化趋势的,pfs 有么
开启之后的内存大小

关闭之后的内存大小
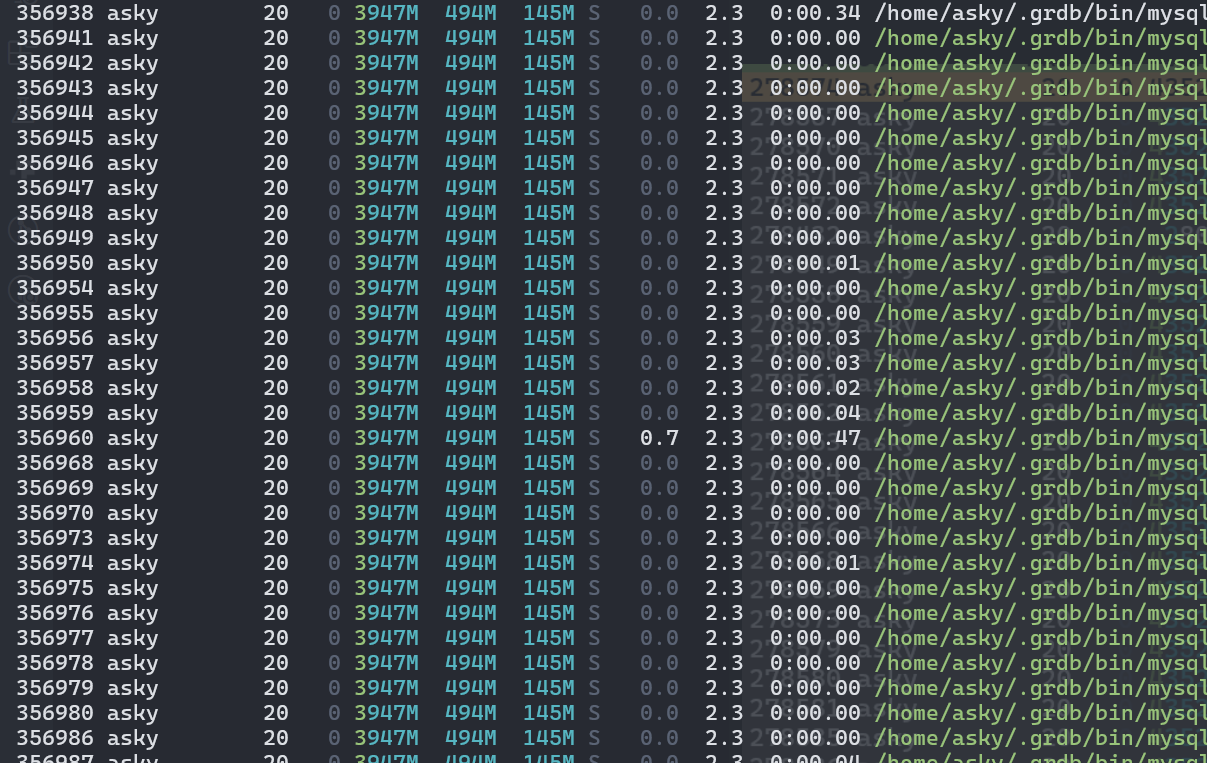
少了大概 300 M
ST_SCHEMA_TABLE
information_schema 中的临时表,用于实现一些实时的内存信息的查询,当前有下面
ST_SCHEMA_TABLE schema_tables[] = {
    {"COLUMN_PRIVILEGES",   column_privileges_fields_info,      fill_schema_column_privileges,  nullptr, nullptr, false},
    {"ENGINES",             engines_fields_info,                fill_schema_engines,            make_old_format,     nullptr, false},
    {"OPEN_TABLES",         open_tables_fields_info,            fill_open_tables,               make_old_format,     nullptr, true},
    {"OPTIMIZER_TRACE",     optimizer_trace_info,               fill_optimizer_trace_info,      nullptr, nullptr, false},
    {"PLUGINS",             plugin_fields_info, fill_plugins,   make_old_format,                nullptr,     false},
    {"PROCESSLIST",         processlist_fields_info,            fill_schema_processlist,        make_old_format, nullptr, false},
    {"PROFILING",           query_profile_statistics_info,      fill_query_profile_statistics_info, make_profile_table_for_show, nullptr,     false},
    {"SCHEMA_PRIVILEGES",   schema_privileges_fields_info,      fill_schema_schema_privileges,  nullptr, nullptr, false},
    {"TABLE_PRIVILEGES",    table_privileges_fields_info,       fill_schema_table_privileges,   nullptr, nullptr, false},
    {"USER_PRIVILEGES",     user_privileges_fields_info,        fill_schema_user_privileges,    nullptr, nullptr, false},
    {"TMP_TABLE_COLUMNS",   tmp_table_columns_fields_info,      show_temporary_tables,      make_tmp_table_columns_format, get_schema_tmp_table_columns_record, true},
    {"TMP_TABLE_KEYS",      tmp_table_keys_fields_info,         show_temporary_tables,     make_old_format, get_schema_tmp_table_keys_record, true},
    {nullptr, nullptr, nullptr, nullptr, nullptr, false}};
在查询的时候,在 add_table_to_list 中会构建相关的 Table_ref 后续在查询中,会使用对应的 fill_xx 填充 table 中 files 的数据